Does the Fed manipulate rates in election years?
If the Fed manipulated the economy to get the incumbent reelected, they would follow a predictable pattern. During election years they would drop rates to spur the economy, only to raise them later to avoid inflation. This manipulation should leave a trace in the bond market. But gathering data and running an analysis with Daggy disconfirms this manipulation theory, suggesting instead that the market doesn't believe the Fed keeps rates low in election years, but rather responds to changes in GDP and inflation.
Modern finance theory states that yields on government debt are made up of two components: expected return and term premium. The expected return tells us what traders believe will happen in the future before accounting for unpredictable events that may also drive yields. This measure keeps predictable factors, like the US election, but strips out unpredictable ones.
To calculate expected return, consider a trader who wants to invest for two years. They could buy a two-year bond or buy a one-year bond and then, one year later, buy another one-year bond. Arbitrage should ensure both strategies yield the same return. The implied price of the one-year bond purchased in one year is called the one-year one-year forward and serves as a proxy for its expected return.
In reality, a two-year bond typically provides a slightly higher return than sequential one-year bonds because the two-year includes a term premium to compensate investors for holding the longer maturing asset. To account for the term premium, the Fed provides estimates for the one and two year going back to 1990. These estimates are tiny. The 2-year bond yield from 1980 through 2025 averaged 4.85%, while its term premium averaged just 0.3%. In the ultra-low interest rate environment of the 2010s, the two-year bond averaged 0.91% while the term premium was -0.02%.
With negligible risk premiums on two-year bonds, we can use the implied forward to estimate the market's expected return of a one-year bond in one year. If the Fed manipulates, then we would expect a year covering the election cycle to have lower expected rates than other years.
We calculated the implied one-year rate for every year since 1980 with bond price data for the first Monday of November of the prior year. This captures traders' predictions for rates one year in the future. Monday simplifies the analysis because markets were closed on election day until 1984 and also strips out any noise around contested elections that may have impacted rates in the short term.
The table below shows summary statistics for the implied one-year bonds. It shows that the market typically expects rates to be high in election years and the lower the year following the election. Before adjusting for the risk-premium, election years saw the highest rates, contradicting a Fed manipulation theory.
| years_after_election | predicted rate | std dev | predicted adjusted rate | std dev |
|---|---|---|---|---|
| 0 | 5.26 | 3.73 | 3.16 | 1.83 |
| 1 | 5.01 | 4.17 | 2.73 | 1.94 |
| 2 | 4.99 | 4.35 | 2.49 | 1.68 |
| 3 | 4.79 | 3.11 | 3.48 | 2.15 |
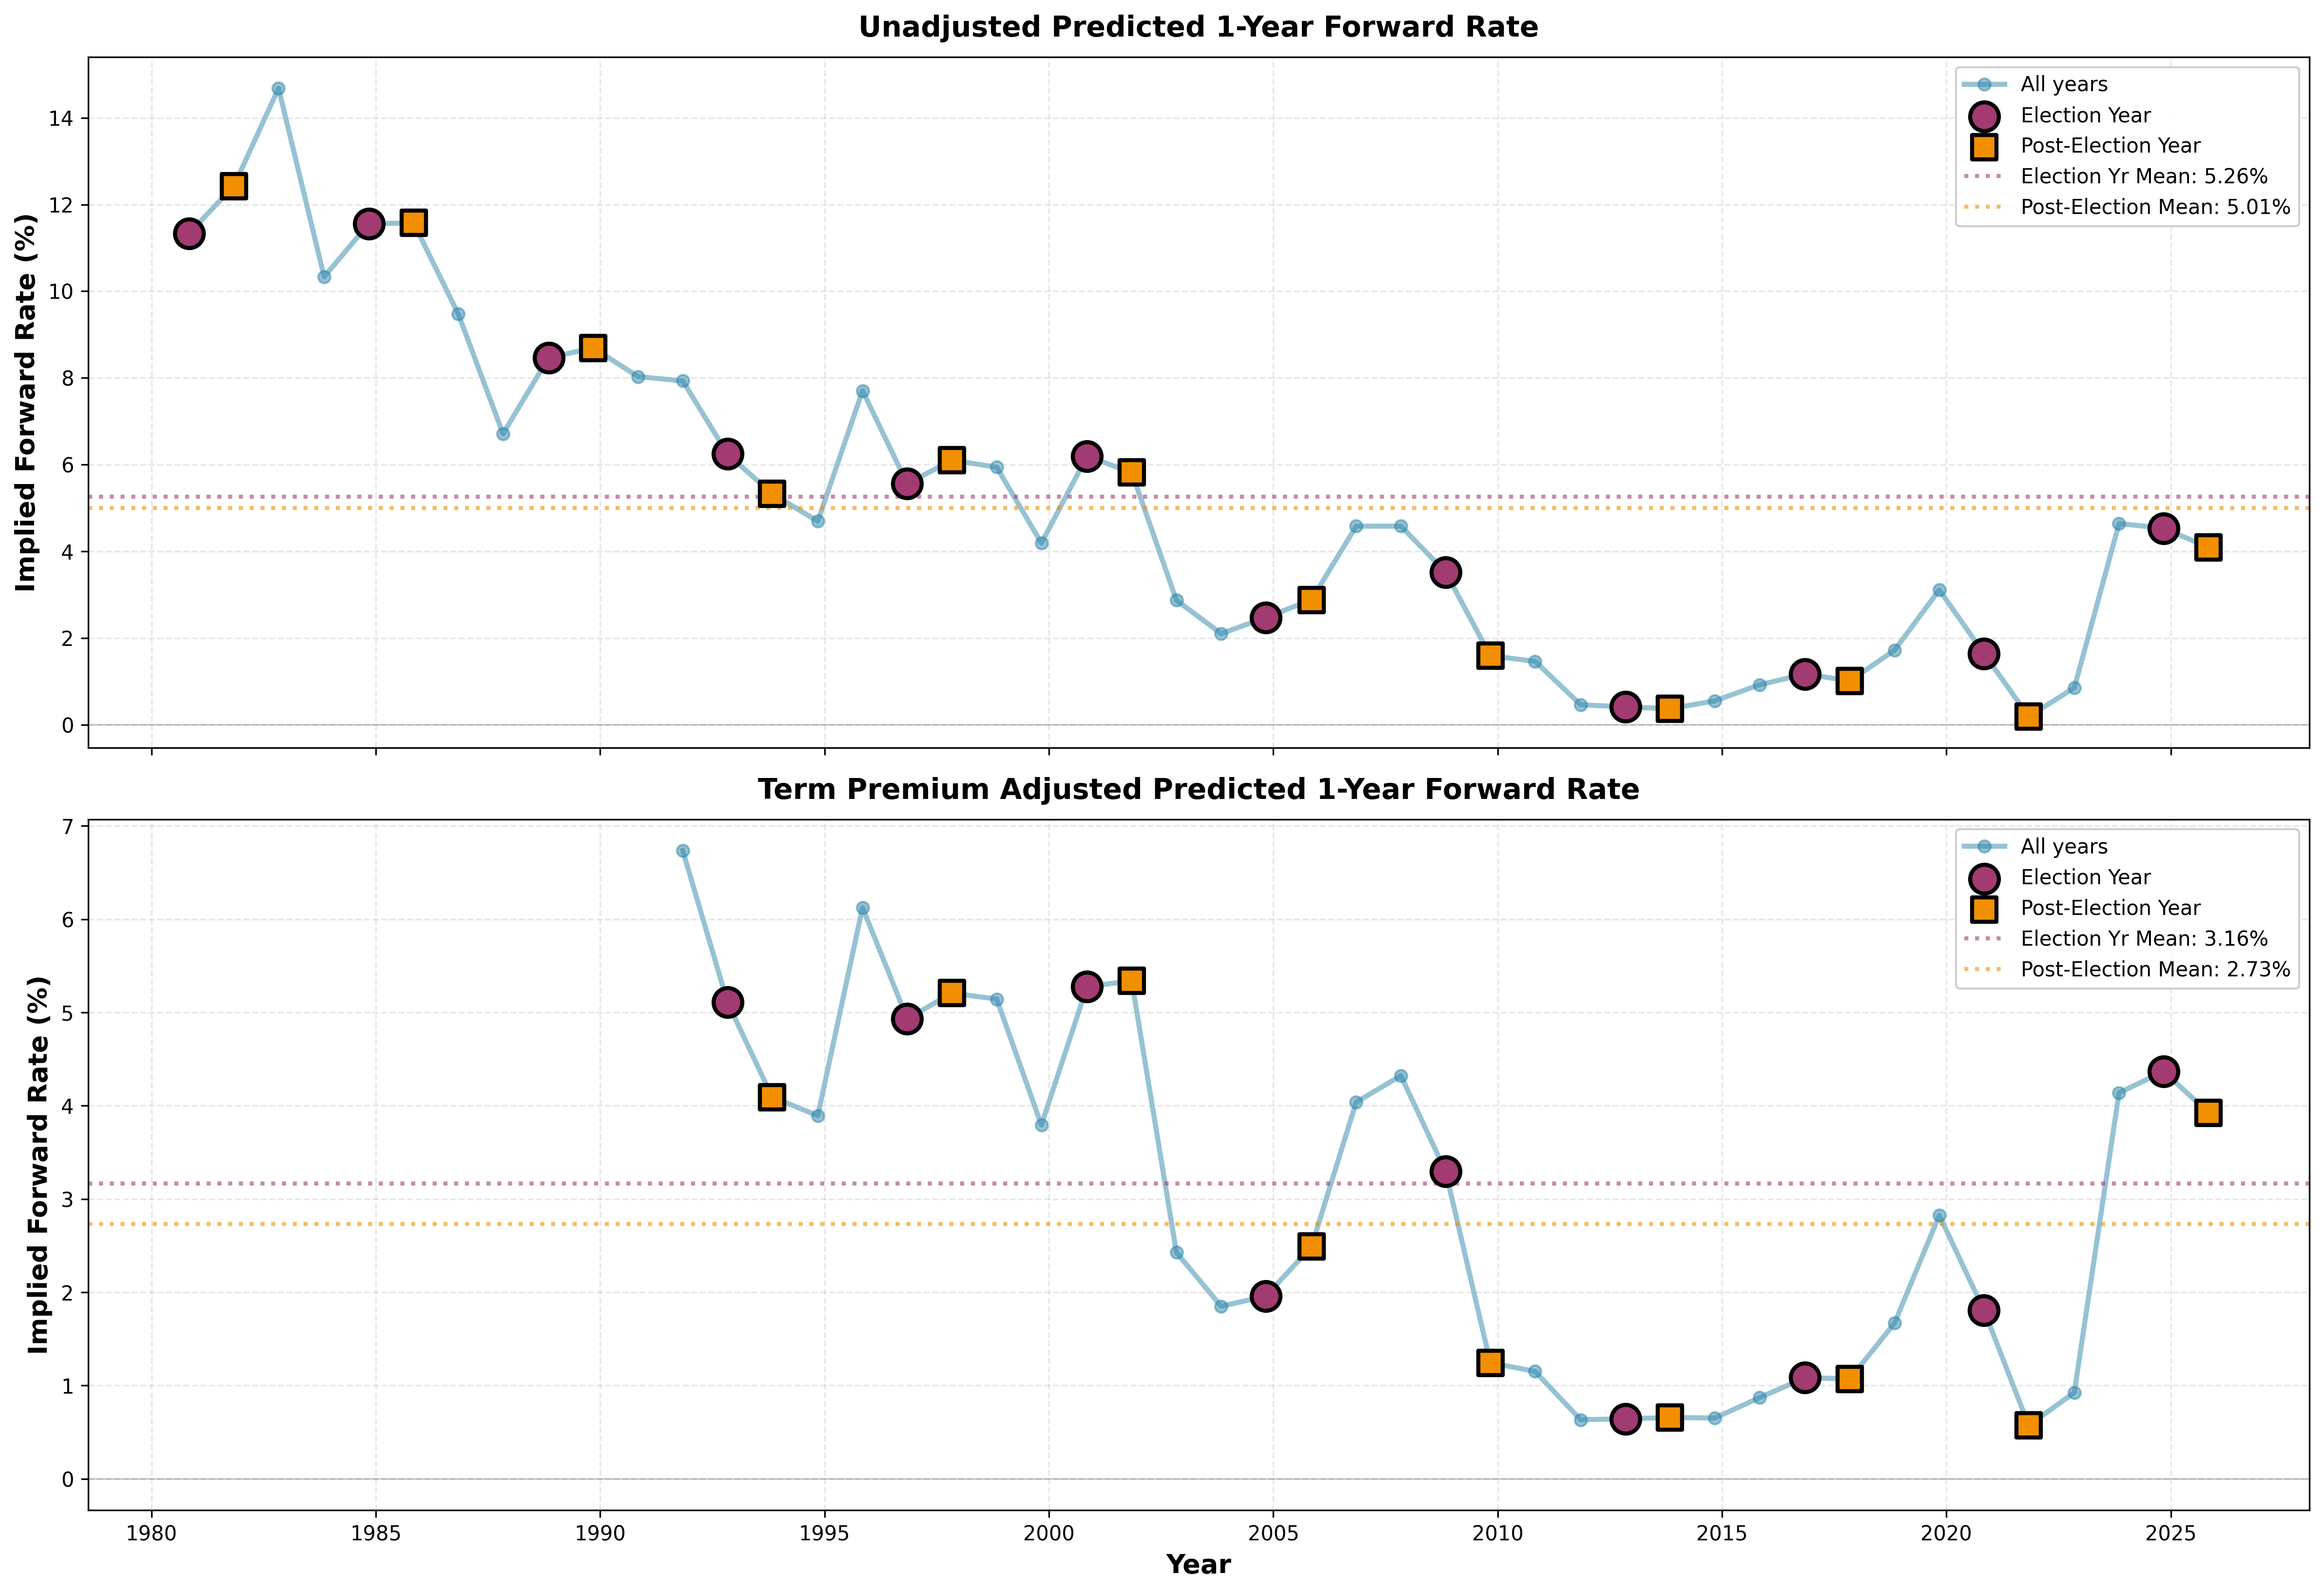
Plotting expected rates over time shows a similar story. Although expected rates consistently fell from the 1980s to 2010s, the figure below shows that election-years don't appear to deviate from the overall trend.
Statistical models let us adjust for changes in GDP and CPI, which should drive the Fed's policy choice, and trends to see whether these variables masked an election year effect.[1] I asked Daggy to build two models using the variables above. One model estimated the level of the predicted rate with a trend feature; the other used a change in the predicted rate to account for the trend. The image below shows the results.
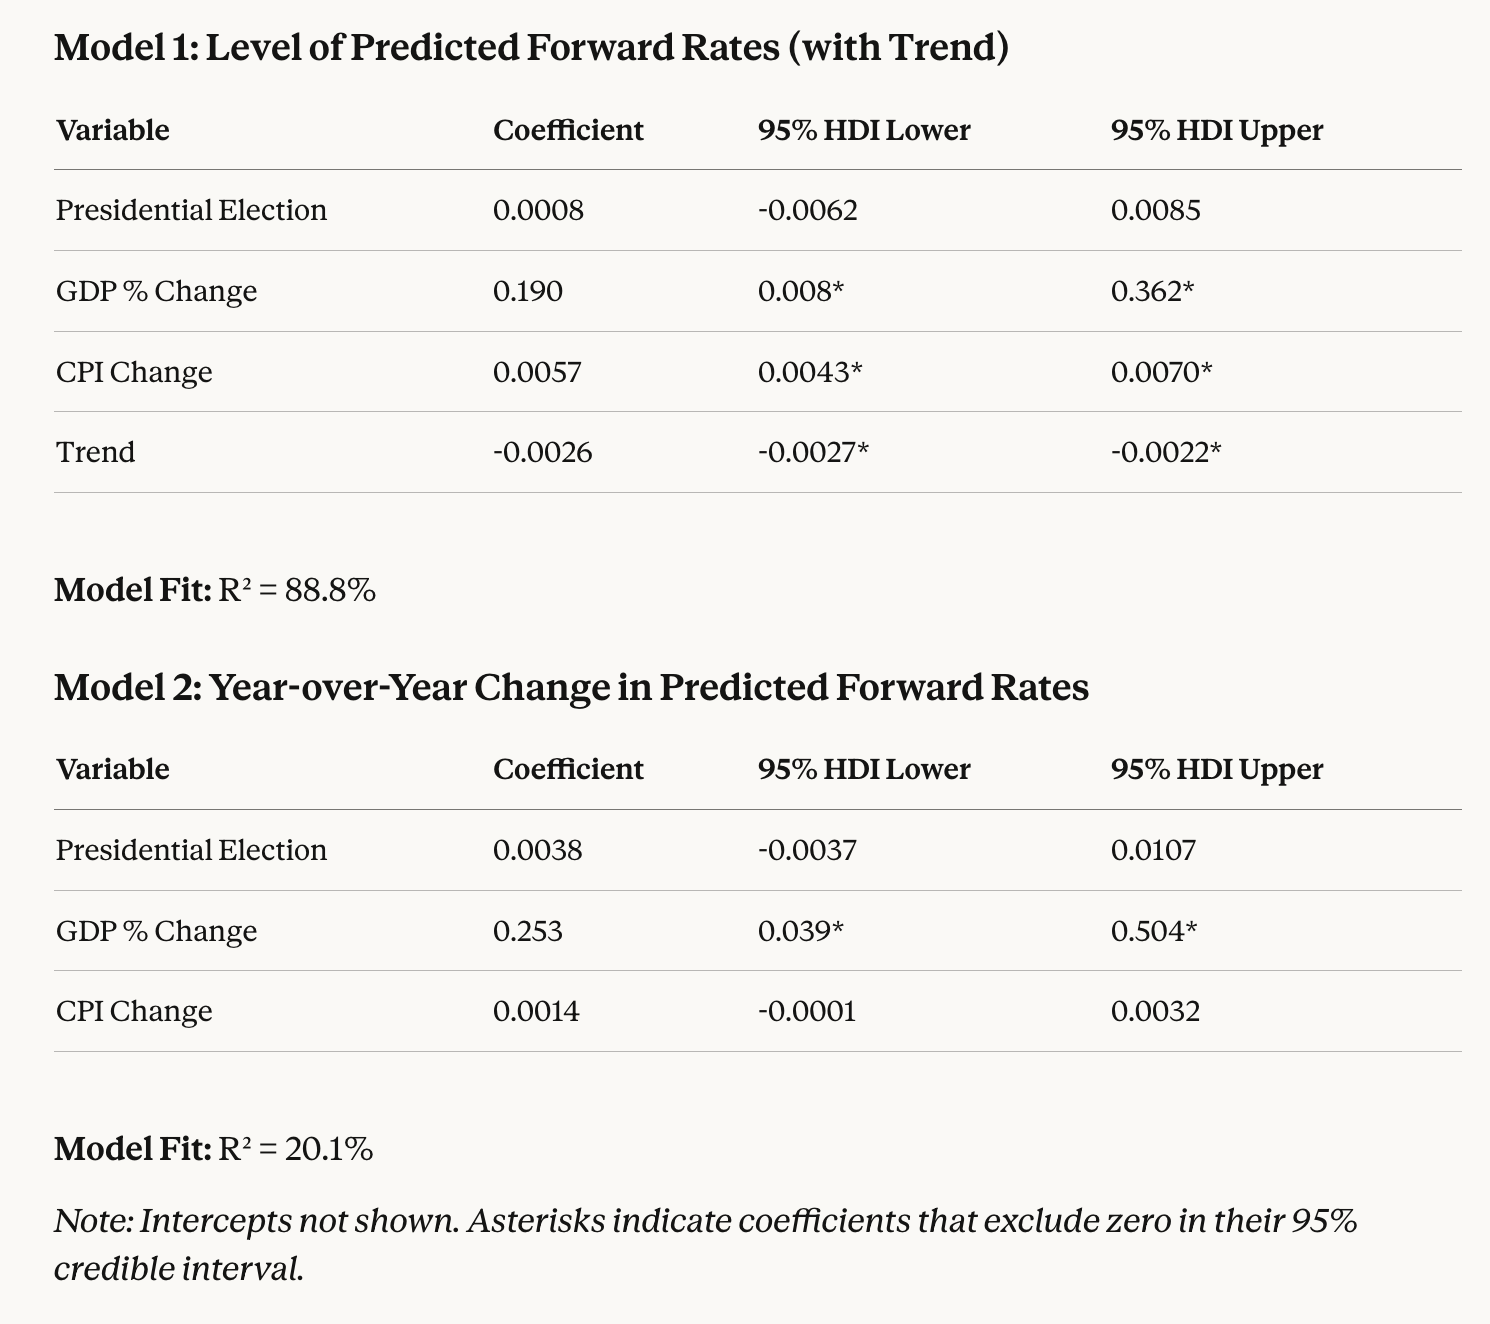
The output shows presidential elections had little impact on the predicted forward. The coefficient is positive, which suggests higher rather than lower expected rates in election years, but near zero. The stronger coefficients for change in GDP and CPI suggest that the market believes these fundamentals drive rates. The trend term drives much of the strong R-squared in the levels model, but the change model's R-squared shows that these three variables explain about 20 percent of the variation in the implied future rate. This is a solid effect, given how many factors drive one-year bond prices. Adjusting for the term premium left the results nearly identical.
This analysis found no evidence that the market believes the Fed manipulates the economy for the president. Expectations moved strongly with changes in inflation and GDP growth, which is unsurprising if the Fed independently follows its dual mandate of price stability and low unemployment.
Footnotes #
We also lagged these variables one period to coincide with when traders made their predictions. ↩︎